
Digital organization usually starts with a deceptively simple question: where should this piece of information go?
The answer depends on what the information actually needs. A folder can tell someone where a file belongs. A tag can describe what that file is about. A graph can show how one idea relates to another, while a database can turn a collection of records into something that can be sorted, filtered, tracked, and automated.
These four models—folders, tags, graphs, and databases—show up everywhere in modern digital work. They are not necessarily competing systems, either. In many cases, the best setup combines two or more of them. The trick is knowing what each model is good at, where it starts to struggle, and what kind of information it was designed to handle.
Folders are one of the most familiar ways to organize digital files. Their structure resembles the physical filing systems people have used for decades: broad categories contain narrower ones, and individual documents sit somewhere within that hierarchy.
That makes folders particularly useful when location and ownership matter. A company might keep documents under Operations, Finance, Marketing, and Engineering, with additional folders beneath each department.
The basic idea is straightforward. A file has a location within a hierarchy, creating a path that can be followed from the top level down to the document itself.
For example, a spreadsheet called Q3_Budget.xlsx might sit inside Finance, which sits inside 2026_Operations. If the folder structure is consistent and the location is known, retrieval is simple: follow the path.
The problem appears when a file belongs to more than one category.
Imagine a research document that concerns both Marketing and Engineering. Which folder should contain it? Putting it in one creates an arbitrary choice. Duplicating it creates another problem: two copies can eventually drift apart.
Folders are especially effective when information has a clear owner, lifecycle, or physical-like location. They work well for documents, project archives, shared drives, and situations where access permissions follow organizational boundaries.
Their biggest advantage is also their biggest limitation. A hierarchy forces a decision about where something belongs. That can keep a system tidy, but it becomes awkward when the information naturally belongs in several places at once.
Tags take a different approach. Instead of asking where an item belongs, they describe characteristics that can cut across a hierarchy.
A single note about customer feedback, for example, might carry tags such as #client-a, #urgent, #ux-research, and #q3. The note does not have to choose one of those categories as its permanent home.
Folders primarily answer “Where does this live?” Tags are better suited to “What is this about?”, “What does it relate to?”, or “Which conditions apply to it?”
That distinction makes tags useful for cross-functional information. A project document can remain in its normal project folder while also being tagged with a department, topic, priority level, or project phase.
Tags also make filtering easier. Searching for #ux-research might return one group of notes, while combining #ux-research with #urgent narrows the result further.
Tags are particularly useful when the same information needs to be viewed from several angles. They can support content libraries, research collections, project notes, photo libraries, and other systems where categories overlap.
There is a catch, though: tags depend heavily on naming discipline.
A system can quickly accumulate #bug, #bugs, #software-bug, and #softwarebugs. Technically, all four may mean roughly the same thing. In practice, they split the information across separate labels and make filtering less reliable.
So tags trade hierarchical rigidity for organizational overhead. They are flexible, but that flexibility needs some governance.
Graphs approach information from another direction entirely. Rather than organizing items primarily by location or label, they focus on the relationships between them.
A graph contains nodes and connections. In a knowledge-management system, a node might represent a note, person, project, concept, book, or source. Links connect one node to another, allowing the structure to grow around relationships rather than predefined categories.
This model is common in personal knowledge-management tools such as Obsidian and Logseq, where users can connect notes through internal links.
Suppose a note covers Behavioral Economics. It might link to Decision Fatigue, Pricing Strategy, and a book review. Those linked notes can point to other ideas, creating a network that becomes richer as more connections are added.
The important difference is that the user does not have to decide on a single permanent location for every concept. Navigation can happen through relationships: one idea leads to another, which leads somewhere else.
That makes graph systems particularly interesting for research and exploratory work. Instead of following a predetermined filing path, the structure can reveal connections that were not obvious at the beginning.
Graphs are well suited to information where relationships matter as much as the individual items themselves. Research notes, interconnected concepts, literature reviews, knowledge bases, and brainstorming are common examples.
But graphs ask more from the person maintaining them. A useful network depends on meaningful links. If notes are created without connections, the graph can fill with isolated nodes that are technically present but difficult to discover.
There is also a learning curve. Someone who simply wants to store a receipt or archive a completed document may gain little from building a network of relationships around it.
Databases are built around structured records. Instead of treating information primarily as files, notes, or connected ideas, they treat it as data with defined fields.
A content calendar is a simple example. Each record might contain a Title, Publish Date, Author, Status, and Category. Once those fields exist, the same collection can be sorted, filtered, grouped, or displayed in different ways.
The defining feature of a database is the separation between the underlying data and the way that data is displayed.
The same content calendar could appear as a spreadsheet-style table, a Kanban board organized by status, a calendar organized by publication date, or a filtered view showing only a particular category.
The records remain the same. The presentation changes.
That distinction is powerful because it prevents the organization system from being tied to one particular view of the information.
Databases are a strong fit for information that needs consistent fields, repeated updates, tracking, or automation. Project management, inventories, customer records, editorial calendars, and task systems are common examples.
They also scale better than ad hoc folders when the number of records grows and the same information needs to be processed in different ways.
The trade-off is setup. A database works best when its fields and rules are reasonably well designed. Changing a schema later can be more involved than simply creating another folder or adding another tag.
One useful way to distinguish these systems is to look at the question each one answers.
ModelPrimary QuestionBest Suited ForMain WeaknessFoldersWhere does this belong?File storage, archives, ownership-based organizationItems may fit several categoriesTagsWhat characteristics apply to this?Cross-functional indexing and filteringNaming can become inconsistentGraphsWhat is this connected to?Research, knowledge management, explorationRequires active linking and curationDatabasesWhat structured data do we need to track?Projects, inventories, records, workflowsRequires more upfront design
This distinction is more useful than simply asking which model is “best.” Each one solves a different organizational problem.
A folder is good at containment. A tag is good at adding attributes. A graph is good at expressing relationships. A database is good at managing structured records.
Real digital workspaces rarely fit neatly into a single category.
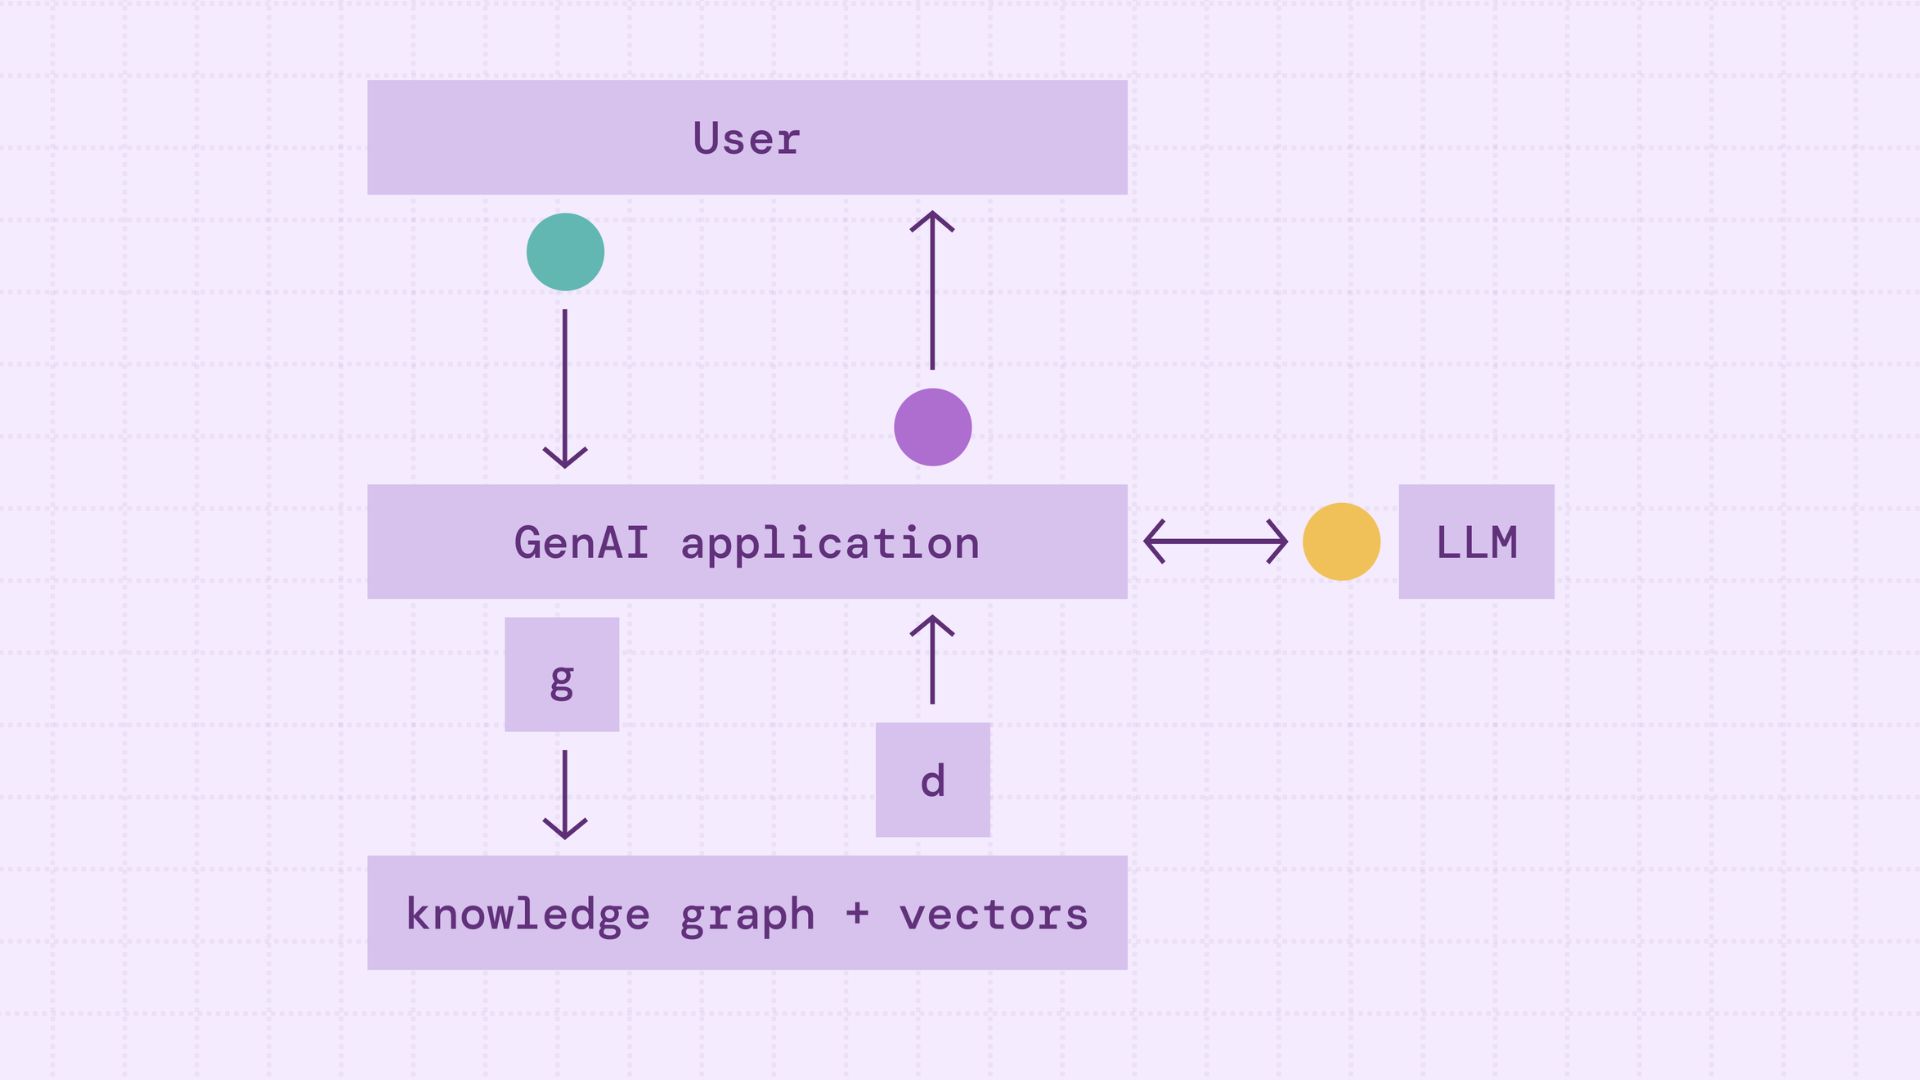
A company might use folders to separate departments and projects, tags to identify document types or topics, and a database to track the status of important files. A research workflow might combine a folder structure for source documents with tags for subjects and a graph for connections between ideas.
Tools such as Notion and Airtable also blur the boundaries. A database can contain pages with unstructured notes, while folders or nested pages provide another layer of navigation. Cloud storage systems may combine hierarchical folders with metadata, search, and filtering.
This hybrid approach makes sense because information itself has several dimensions. A project document has a location, attributes, relationships, and potentially structured properties such as status or deadline. Trying to force all of those characteristics into one organizational model usually creates unnecessary friction.
The easiest way to choose a model is to start with the nature of the information rather than the tool.
If the main concern is where something belongs, folders are usually a natural fit. If the same item needs to be discovered through several attributes, tags can add the flexibility that a hierarchy lacks.
When the important question is how ideas or entities relate to one another, a graph becomes more useful. And when information consists of repeatable records with fields, statuses, dates, or other structured properties, a database is usually the stronger choice.
The bigger lesson is that organization is not just about putting things somewhere. It is about making the next interaction with that information easier. A folder should make retrieval predictable. A tag should make filtering easier. A graph should make relationships visible. A database should make structured information easier to manage.
Good information architecture does not come from choosing the most sophisticated model. It comes from choosing the model that matches the work—and knowing when two or more models should be combined.